14 Essential branding metrics to measure in 2025

Discover the 14 branding metrics brands like Nike, LuluLemon, MailChimp and Hubspot use to measure the success of their digital marketing efforts.
A good brand strategy is the driving force behind and in front of a successful business. Branding helps customers relate, trust, and invest in businesses worldwide. Understandably, building a brand via digital marketing tactics is a tricky mountain to conquer. It’s doable; LuluLemon, Nike, MailChimp, and Hubspot have proven as much, there are just a lot of moving parts.
It’s part of every marketer’s marketing strategy to build and maintain a brand that trumps competition and has the power to up customer lifetime value. It means that most marketers are tracking branding metrics to ensure their branding and marketing efforts are going well. Yet, it can be hard to pinpoint what branding metrics should matter for your business and its specific goals.
In this article, we’ll outline the 14 branding metrics you need to be aware of if you’re looking to up your branding game in 2022 and beyond. By the end of this article, you should have a clear understanding of the branding metrics that will take your awareness goals to the next level and ultimately help your bottom line financials. For further information, see our guide on how to measure brand awareness.
Everything you need to know for your Brand Tracking
Our in-house experts—the Customer Research Team—have created super-useful guides and tips on how to run a successful brand tracking project.
Branding metrics to measure
Brand tracking data can get a little overwhelming at the best of times- but our brand tracking case studies show it can also be beneficial to analyze. It’s essential to take each of these metrics with a pinch of salt, track what you can handle, what you can realistically learn from, and utilize.
At the same time, it’s crucial you don’t shoot for vanity metrics when tracking your brand’s performance. We’re here to analyze and apply an ROI to our branding efforts. We can’t always expect to find those percentage increases that will have leadership jumping out of their seats. Perhaps we’ll see results that didn’t go as planned—that’s okay—as long as we learn from them and adapt our branding strategy for next time.
1. Viewable impressions
Viewable impressions is a relatively ‘low-barrier-to-entry’ branding metric to track. It’s an easy metric to build fantastic numbers around in the PPC world. However, is it that effective? Depending on where you were spending your cash, it used to vary on what a ‘viewable impression’ actually was.
However, thanks to the Interactive Advertising Bureau (IAB) and the MRC (Media Rating Council), there’s now an industry standard to this metric. A viewable impression counts if 50% of the ad or more is viewable for one second (display ads) or two seconds (video ads).
How much a viewer can really benefit from seeing 50% of a message in one or two seconds is up to you to decide.
Viewable impressions = Number of 1 or 2-second views on 50% of the branding effort
2. Branding linkage
This is always a surprising metric to track and can give your advertising team a real insight into whether their creative freedom is on track or perhaps a little too free and therefore not consistent.
Branding linkage means if a viewer can associate an unbranded marketing effort from your business as being connected to your business. Essentially, if you were to remove any logos, slogans, or other blatant giveaways (like Ronald McDonald the clown from a McDonald’s ad) would someone still be able to tell it was from your brand?
How do you measure this metric? Creative testing surveys are the perfect way to measure this. And A/B testing is a good way to go if you want to check which of your design concepts are most on-brand before releasing your advertisement to the masses.
Branding linkage = Brand association after a ‘non-branded’ content effort
The complete guide to creative testing
Learn how to test your creative assets with consumers before you release them into the wild.
Get your copy now!3. Visibility
Visibility is also referred to as your brand share of voice. It refers to the share of advertising, online mentions and PPC your brand has compared to all the competitors in your niche. It can be measured in numerous ways, depending on the tactics you’re using.
Perhaps your brand marketing campaigns consist of hosting thought leaders in live webinars and maybe you’re running competitive pricing PPC ads against competitor names.
Whatever you’re doing to increase brand visibility, find ways to measure it that are in line with your tactics and can help you get a hold on the percentage of market share you hold over competitors. Good brand visibility rates reduce bounce rates, increase all types of conversion rates, and ultimately build a more trustworthy business.
4. Persuasion
Oh, the power of persuasion. For those among us that studied marketing, we’re sure Cialdini’s six principles are racing to the front of your mind. Yet, how do you measure something like persuasion? In branding, measuring persuasion helps you determine how effective—and persuasive— your branding efforts are.
An easy way to measure this would be with a consumer survey that asks respondents how likely they are to purchase, sign up, or otherwise engage with your brand after seeing your marketing campaign.
Another way is with a cohort analysis within a customer journey. Show one group of potential customers a strong brand-building piece of content before a signup form or conversion opportunity, and don’t show this piece of content to another cohort. Which cohort converts better?
Persuasion = Number of increased conversions after branding effort
5. Retransmission
It sounds a lot more complicated than it actually is. Retransmission is whether someone feels strongly enough about your brand or your brand effort to share it with friends and family.
There are a lot of names for this in the marketing world; brand ambassadors, organic influencers, brand advocacy, word-of-mouth advertising, organic referrals. But, when it comes to awareness of your brand, this is all rolled into retransmission.
Is your brand message relayed to another group of people you previously did not have access to? This metric hints at brand growth, customer retention, and brand loyalty.
Retransmission = Increase in the brand name or content shares
6. Sales
As mentioned at the beginning of this article, different businesses will have different branding goals. Perhaps sales is not a KPI of your branding efforts – at least not directly. As you’ll see in this article, there are a ton more brand health checks and metrics to track that are more timely and can be closer tied to your branding efforts.
However, sales is a metric that every team should have a pulse on. Perhaps you’ll need to track sales in the coming weeks or even months to give customers a chance to walk through their customer journey and your sales funnel.
Or, if you’re in a faster-paced industry like e-commerce, sales could reflect your efforts from that very same day. Be cautious with this one and use Google Tag Manager or trackable links to attribute your sales to your branding efforts correctly.
Sales = Avg. increase of products sold after branding efforts
7. In-view time
We’ve discussed viewable impressions, but what happens when we want to beat the industry minimum and try to make a larger impression with brand recognition? In-view time counts for the amount of time your ad or branding effort is in front of someone’s eyes.
You’re no longer looking at a minimal impression. Instead, you’re looking at having a lasting effect. Measuring in-view time enables you to build more than awareness around your branding; it allows you to build awareness around your business and your product.
When it comes to video efforts, in-view time can help you determine how much of a video someone has seen, and therefore how much they have learned. When it comes to messaging, you can have a ‘time to read’ idea for your copy and align that with how much viewers will have consumed.
For example, let’s say your in-view time was three seconds, and your time to read was four seconds, someone has potentially consumed 75% of your brand message.
When it comes to overall branding, research shows that anything up to a minute can be fantastic for brand recall; anything after that has marginally more impact.
In-view time = Amount of time (over two seconds) 50% or more of branding efforts is on screen
8. Universal interaction rate
Universal interaction rate (UIR) is a great way to measure advertising efforts and someone’s engagement with your brand. At the forefront of future brand advertising strategies is interactive advertising, and it’s essential when measuring this branding metric.
Universal interaction rate is the percentage of campaign impressions in which someone interacted with your advertisement—preferably for more than 0.5 seconds.
It shows that you’ve sparked someone’s attention enough for them to want to learn more. Your mind is probably jumping to CTRs, but you don’t need to measure anything more than this right now. We’re not looking at sales metrics here, we’re looking at awareness.
UIR = percentage of interactive impressions
9. Brand favorability
The hint is the name with this one; brand favorability is how positively someone feels about your brand after your branding efforts. We’re not looking at the emotions you want them to feel. For example, Nike would like you to feel empowered. We’re looking at how they feel towards your brand; whether they favor you or not.
This important branding metric is best measured through a consumer survey. After respondents view your marketing campaign assets, do they feel closer to the brand? Do they feel more trust or loyalty towards it?
In addition to gathering quantitative responses, you can also add in an open text question to understand why the campaign has changed the way consumers feel about your brand. If you see the campaign is not having the desired effect, these qualitative responses will give you a good idea of what needs changing.
Brand favorability = % of people positively inclined towards your brand after seeing marketing effort.
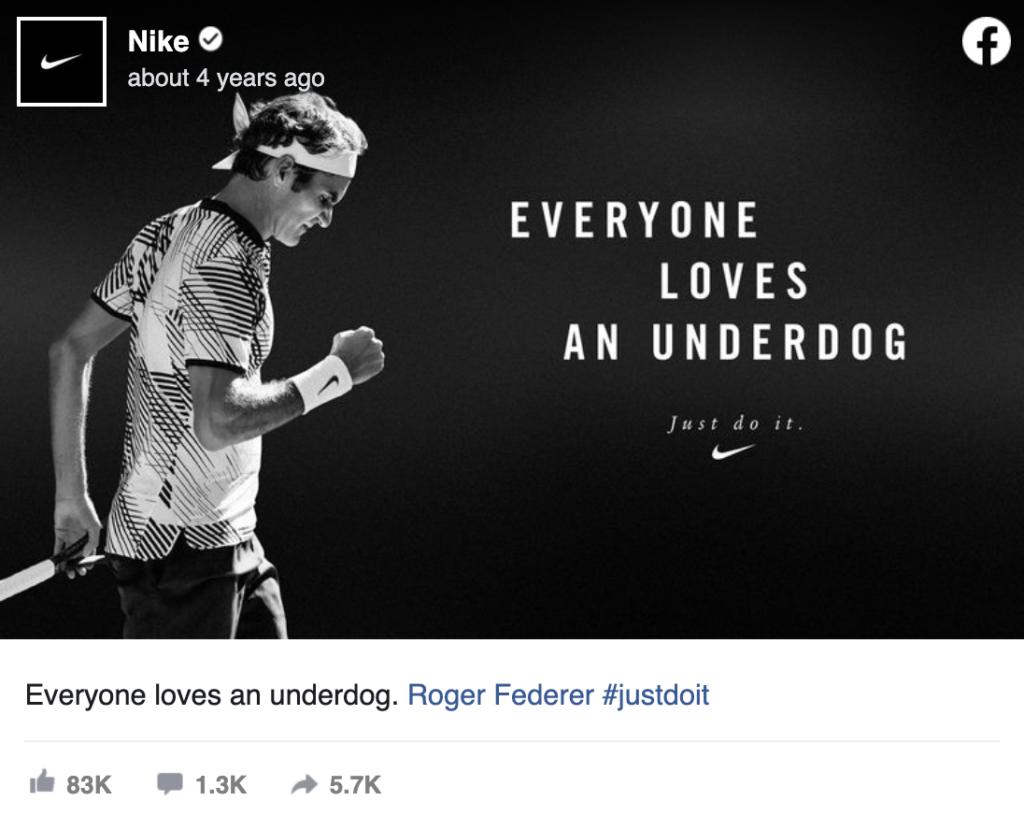
10. Social shares
Social shares are a great way of affirming your retransmission branding metric we mentioned earlier and social media marketing efforts.
Social media is a powerful tool when it comes to branding. However, it’s been around for a while, and people are becoming more conscious about the content they’re sharing. If your branding optimization efforts can win a social share, then you’re doing something right – keep doing it!
11. Social engagement
Much like with social shares, it can be hard to win someone’s attention and positively disrupt someone’s day on social media. Plus, with the likes of Facebook and LinkedIn giving more screentime to friends and family over brands (unless they’re paying for it), social engagement is a great goal to track, but hard to win.
Track your likes, comments, and saves. They’re excellent content performance indicators and help you understand how engaging, relatable, or useful the brand you’re building online is perceived to be.
12. Social growth
Whether you track this month-on-month or quarter-on-quarter, social growth is a branding metric you need to watch, but not necessarily one you need to prioritize. If you’re hitting your engagement and share targets with content, then there’s a high chance your social growth will be a secondary effect of your efforts.
Social growth = number of new followers minus number of lost followers
13. Social reach and impressions
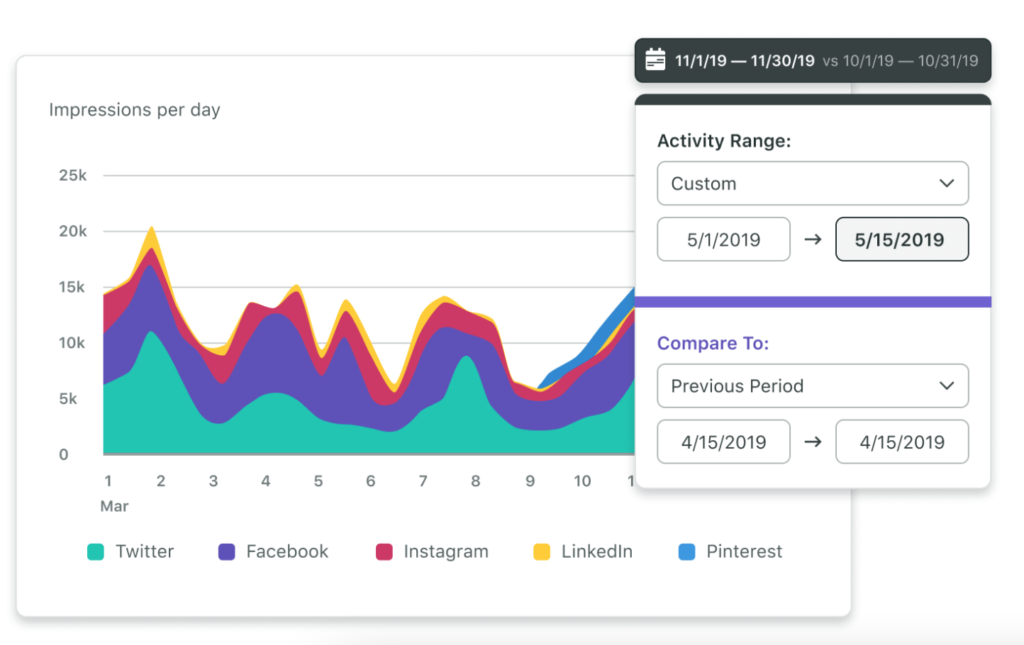
These branding metrics means focusing on conquering the ever-elusive social algorithms. There are a million and one tactics you can use to build your reach and impressions. However, tracking them is a little more straightforward. All you need is the right social media management tool, or you can do it manually within each platform.
Reach and impression growth implies your brand is getting the eyeballs it deserves – at a fraction of the cost. Organic growth for the win!
14. Branded searches
Brand name searches are quite possibly the crème de la crème of branding KPIs and a brand SEO metric that every brand needs to be tracking. Branded searches are the perfect display of all of your branding efforts accumulating in one space. It’s simple, the more people searching for your brand name represents the more people interested in your brand and what you do. Whether they want to learn more or are actively ready to buy, it’s a huge win to see this number and your website traffic on the rise.
Google has some smart tools in its toolkit to help you track this metric, like Google Analytics and Google Search Console, and it’s one well worth watching.
Get started tracking branding metrics
There are tons of tools available to help you track branding metrics and give you helpful brand awareness ideas to grow your business. If you want to learn more about using consumer survey data to understand the impact of your digital marketing efforts, why not book an introduction to Attest or live chat with the team?
Tell us what you think of this article by leaving a comment on LinkedIn.
Or share it on:

